Within Regional Scenes
When Streams Become Proof Of A Scene
Streaming counts, city-level listening and royalty data can help regional scenes persuade labels, promoters and collaborators that demand exists.
On this page
- What streaming data can prove
- How labels and promoters read demand
- Where data can misrepresent real cultural value
Page outline Jump by section
Introduction
Streaming platforms have changed more than music distribution. They have created a new form of evidence. For regional music scenes trying to attract label investment, festival bookings, media attention or international collaborators, listening data can now function as proof that an audience exists. Instead of relying solely on local reputation, radio support or anecdotal buzz, artists and scene organisers can point to measurable patterns: streams, listener locations, playlist additions, audience growth and royalty flows. These metrics help transform a local cultural movement into something that looks legible to investors and gatekeepers. At the same time, the power of data introduces governance questions about who controls measurement, which signals count as success, and what forms of cultural value remain invisible. [Spotify for Artists]artists.spotify.comhow to read your spotify for artists dataSpotify for ArtistsHow to Read Your Spotify for Artists Data24 Feb 2020 — The Spotify for Artists app puts a bounty of listener data at y…

What Streaming Data Can Prove
Regional scenes rarely persuade outsiders through raw stream totals alone. The more valuable evidence often comes from the structure of listening patterns.
Streaming platforms and music analytics services can reveal: [chartmetric.com]chartmetric.comTrack listener age distributions, geographic…Read more…
- Which cities generate the most listeners.
- Whether audience growth is sustained or temporary.
- How much listening comes from outside the scene’s home region.
- Which songs trigger international discovery.
- Whether listeners save tracks, revisit artists and engage repeatedly.
- Where royalties are actually being generated. [Orphiq]orphiq.comspotify for artists listener locationsOrphiqSpotify for Artists Listener Locations Explained11 May 2026 — How to find Spotify for Artists listener locations, what the city and… [soundcharts]soundcharts.comSoundchartsSpotify Analytics: Playlists, Charts & AudienceMonitor Spotify stats for 2M+ artists. Track followers, charts, playlist exposu… For a promoter considering a first booking, city-level concentration can matter more than national popularity. A regional scene from one country may discover unexpectedly strong audiences in London, Paris, Toronto or Mexico City. Those patterns become evidence that travel, marketing and venue investment might be justified. Analytics platforms such as Chartmetric and Soundcharts were built partly around this need to translate audience geography into actionable business intelligence. How Music Charts [Water and Music]waterandmusic.comhow the touring industry will use data in 2021 even in a pandemicWater and MusicHow the touring industry will use data in 20219 Dec 2020 — Soundcharts is one of many tools that promoters and agents can…
Royalty data adds another layer of proof. Spotify’s Loud & Clear reporting has repeatedly shown that international listening is increasingly important to artist income. By 2026, Spotify reported that artists on average received more than half of their royalties from outside their home country only two years after debuting. This matters because it demonstrates that streaming demand is not merely symbolic attention; it can generate measurable economic activity across borders. Spotify [Loud and Clear]loudandclear.byspotify.comLoud and ClearSpotify Loud & ClearThis site shares data behind Spotify's royalty payments and explains how money flows through the global…
How Labels and Promoters Read Demand
A regional scene’s streaming footprint becomes persuasive when it reduces uncertainty.
Why A&R Teams Care About Geography
Artists and Repertoire (A&R) departments increasingly use analytics tools to identify developing markets before traditional industry indicators catch up. Geographic clustering can signal that a scene is gaining traction beyond its original community. Instead of asking whether a genre is culturally interesting, decision-makers can ask whether audience growth appears repeatable and scalable. [PopFiltr for Artists]artists.popfiltr.comPop Filtr for Artists ChartmetricPopFiltr for ArtistsChartmetric - Empowering Artists with Data26 Jun 2024 — Chartmetric empowers artists with the data-driven insights th…
For example, a cluster of growing listeners across multiple cities may suggest that a scene has crossed from local enthusiasm into wider networked adoption. Data can also reveal “trigger cities”—places where new music spreads unusually quickly and often predicts wider growth. These cities become important indicators for labels seeking early signs of international potential. [Chartmetric Reports]reports.chartmetric.comtrigger citiesChartmetric ReportsChartmetric Trigger Cities 2024Explore Chartmetric's trigger cities and learn how emerging artists and A&R executives…
How Promoters Turn Streams Into Shows
Promoters often compare streaming locations with venue capacity, ticket history and social engagement. A city showing strong streaming numbers may justify a trial booking, support slot or festival invitation. Tour planners increasingly use streaming geography to decide routing, venue size and local partnerships. [How Music Charts]hmc.chartmetric.comhow to plan a tour using streaming data part 3How Music ChartsHow to Plan a Tour Using Streaming Data: Part 3April 16, 2020 — Learn what venues to book, how to negotiate with local pr… [How Music Charts]hmc.chartmetric.comhow to plan a tour using streaming data part 3How Music ChartsHow to Plan a Tour Using Streaming Data: Part 3April 16, 2020 — Learn what venues to book, how to negotiate with local pr…
This does not mean streams automatically translate into ticket sales. Industry analytics guides consistently warn that streaming data is only one input among many. Experienced promoters cross-reference listening patterns with local fan activity, historical attendance and community engagement before committing resources. [How Music Charts]hmc.chartmetric.comhow to plan a tour using streaming data part 3How Music ChartsHow to Plan a Tour Using Streaming Data: Part 3April 16, 2020 — Learn what venues to book, how to negotiate with local pr…

When Regional Scenes Become Export Markets
Streaming data is especially valuable for scenes attempting to prove export potential. If a genre develops a measurable overseas audience, labels can justify international marketing budgets, translation efforts, touring support and collaborative projects.
Recent Spotify reporting has highlighted how artists from increasingly diverse countries derive substantial income from foreign audiences. More than 50% of royalties now come from abroad on average, and artists generating significant royalty income represent dozens of countries rather than a small number of dominant music markets. This helps regional scenes argue that they are not dependent on domestic demand alone. Spotify [Loud and Clear]loudandclear.byspotify.comLoud and ClearSpotify Loud & ClearThis site shares data behind Spotify's royalty payments and explains how money flows through the global…
When Streaming Data Strengthens a Scene’s Story
Data becomes most powerful when combined with a clear narrative.
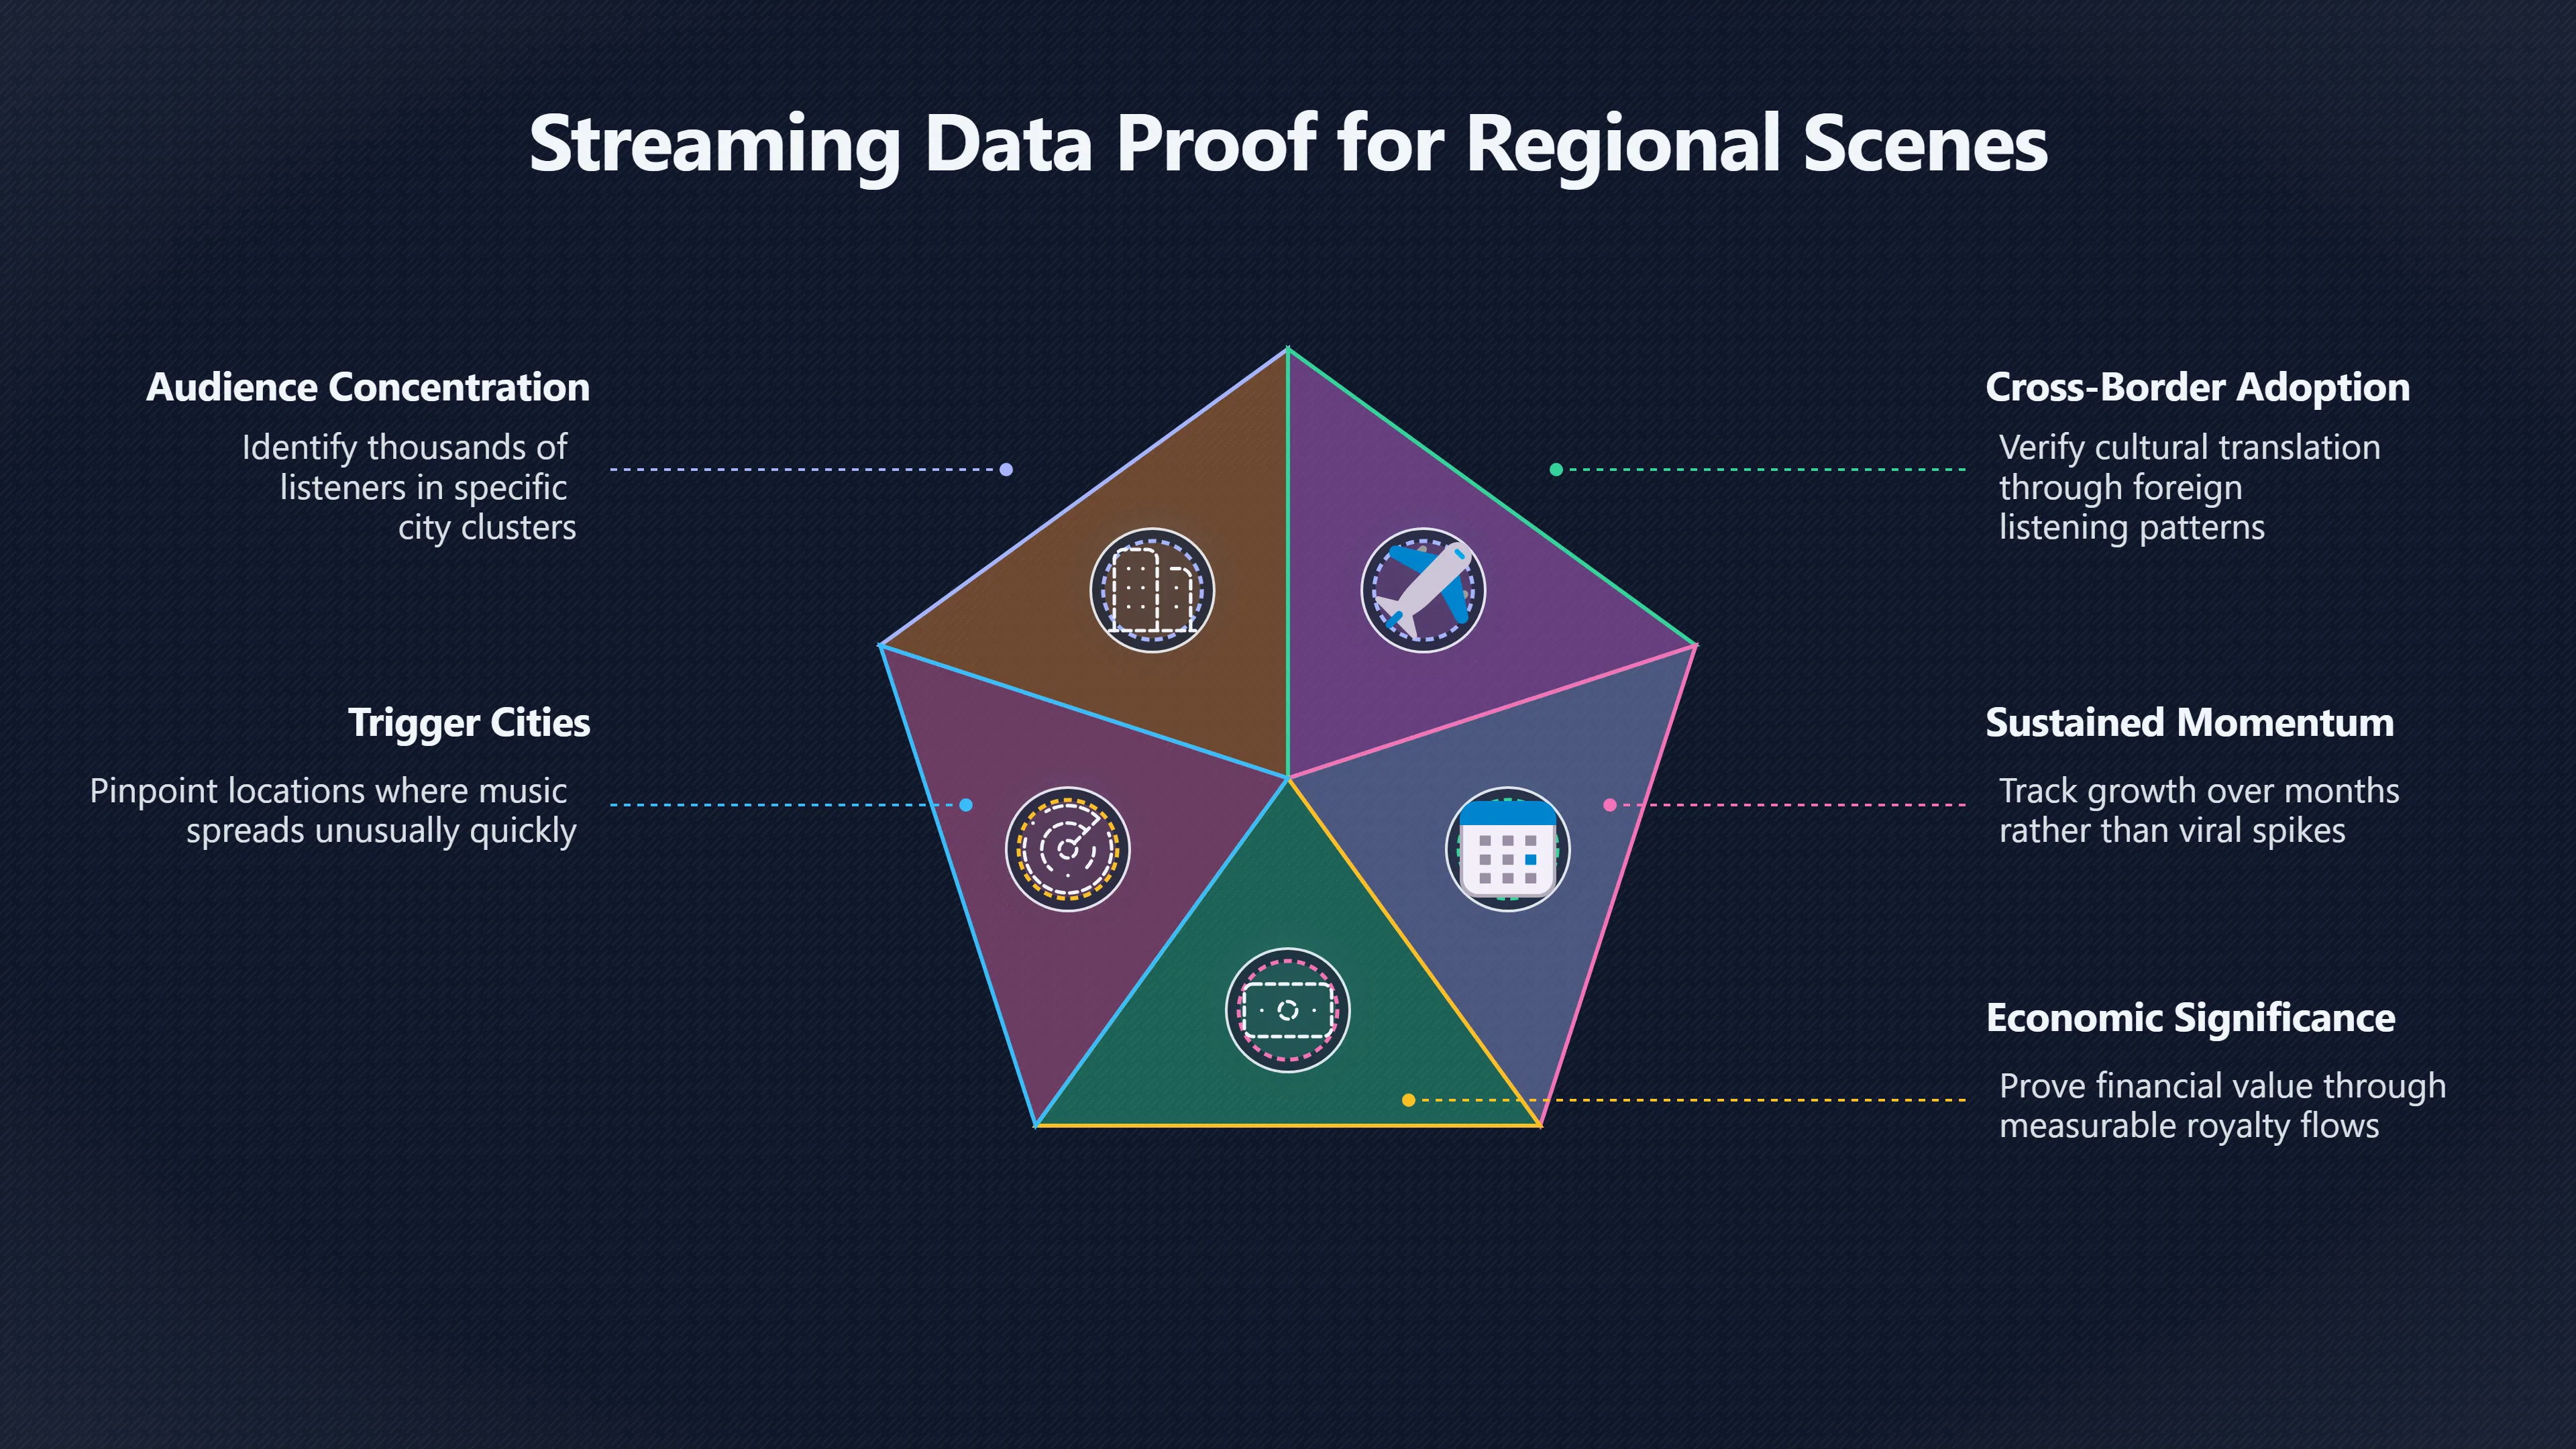
A regional scene can use streaming evidence to demonstrate:
Audience concentration. Thousands of listeners in specific cities may indicate genuine local communities rather than scattered casual listeners.
Cross-border adoption. Foreign listening can show that cultural translation is already occurring without heavy industry intervention.
Sustained momentum. Growth over months or years is more persuasive than a brief viral spike.
Economic significance. Royalty flows provide evidence that attention is creating financial value. [Orphiq]orphiq.comspotify for artists listener locationsOrphiqSpotify for Artists Listener Locations Explained11 May 2026 — How to find Spotify for Artists listener locations, what the city and… Spotify This kind of evidence is particularly useful when scenes seek festival representation [artists.spotify.com]artists.spotify.comhow to read your spotify for artists dataSpotify for ArtistsHow to Read Your Spotify for Artists Data24 Feb 2020 — The Spotify for Artists app puts a bounty of listener data at y…, cultural funding, export support programmes or international partnerships. Numbers help convert cultural claims into arguments that institutions recognise.
Where Data Can Misrepresent Real Cultural Value
The same metrics that make regional scenes visible can also distort how they are understood.
Streams Are Not Communities
A stream measures a listening event, not cultural commitment. A city with high stream counts may have weak local infrastructure, few active fans and little appetite for live events. Conversely, a scene with deep local influence may appear modest in platform analytics because its importance depends on clubs, radio, social networks or informal circulation rather than streaming volume. [How Music Charts]hmc.chartmetric.comhow to plan a tour using streaming data part 3How Music ChartsHow to Plan a Tour Using Streaming Data: Part 3April 16, 2020 — Learn what venues to book, how to negotiate with local pr…
Platform Metrics Reflect Platform Priorities
Streaming data is created inside systems designed by private companies. Platforms decide which metrics are visible, how listeners are counted and which forms of engagement receive emphasis. Researchers have long noted that artist-facing analytics encourage musicians to view audiences through measurable indicators, potentially narrowing definitions of success. [ResearchGate]researchgate.netResearch Gate(PDF) Data Matters2017)May 2, 2017 — 5 May 2017 — PDF | On May 2, 2017, Andrew Rae published Data Matters - 'Spotify For Artists' - Rae, A. (2017) | Find…
A regional scene may therefore optimise for what platforms can count rather than what local culture values. Community influence, artistic innovation, grassroots mentorship and local identity often resist simple quantification.

Economic Transparency Has Limits
Royalty statistics provide useful evidence of international demand, but they do not necessarily reveal how revenue is distributed after labels, distributors, publishers and other rights holders receive their shares. Critics of streaming economics argue that platform-level transparency can obscure continuing inequalities within the wider music industry. [The Guardian]theguardian.comThe Guardian Spotify is trumpeting big paydays for artistsThe 2024 report claims that Spotify paid out $10bn in royalties last year, but the report's timing is contentious due to recent revelatio… [Pitchfork As a result]pitchfork.comThe initiative follows protests from the Union of Musicians and Allied Workers demanding better payment. Spotify provided data showing th…, strong streaming data should not automatically be interpreted as proof that a scene is financially healthy or that most participants are benefiting equally.
Why Data Proof Matters
Streaming has given regional scenes a language that powerful institutions already understand: measurable demand. City-level listening, audience growth and royalty flows allow local movements to demonstrate that their reach extends beyond anecdote and reputation. For labels, promoters and collaborators, these datasets reduce uncertainty and support investment decisions. Yet data remains evidence rather than truth. It can reveal where a scene is being heard, but not fully explain why it matters, how deeply it is embedded in communities or what cultural significance it carries. The most successful regional scenes use streaming metrics not as a replacement for cultural value, but as proof that cultural value is finding listeners.
Amazon book picks
Further Reading
Books and field guides related to When Streams Become Proof Of A Scene. Use these as the next step if you want deeper reading beyond the article.
All You Need to Know About the Music Business
Explains industry use of data, royalties and commercial signals.
Music Streaming around the World
Addresses streaming metrics and platformization globally.
eBay marketplace picks
Marketplace Samples
Example marketplace items related to this page. Use the search link to explore similar finds on eBay.


Endnotes
-
Source: artists.spotify.com
Title: how to read your spotify for artists data
Link: https://artists.spotify.com/blog/how-to-read-your-spotify-for-artists-dataSource snippet
Spotify for ArtistsHow to Read Your Spotify for Artists Data24 Feb 2020 — The Spotify for Artists app puts a bounty of listener data at y...
-
Source: orphiq.com
Title: spotify for artists listener locations
Link: https://orphiq.com/resources/spotify-for-artists-listener-locationsSource snippet
OrphiqSpotify for Artists Listener Locations Explained11 May 2026 — How to find Spotify for Artists listener locations, what the city and...
Published: May 2026
-
Source: soundcharts.com
Link: https://soundcharts.com/en/spotify-analyticsSource snippet
SoundchartsSpotify Analytics: Playlists, Charts & AudienceMonitor Spotify stats for 2M+ artists. Track followers, charts, playlist exposu...
-
Source: chartmetric.com
Link: https://chartmetric.com/Source snippet
Track listener age distributions, geographic...Read more...
-
Source: hmc.chartmetric.com
Title: how to plan a tour using streaming data part 3
Link: https://hmc.chartmetric.com/how-to-plan-a-tour-using-streaming-data-part-3/Source snippet
How Music ChartsHow to Plan a Tour Using Streaming Data: Part 3April 16, 2020 — Learn what venues to book, how to negotiate with local pr...
Published: April 16, 2020
-
Source: newsroom.spotify.com
Title: As Spotify Turns 20, the Most Global and Diverse Music
Link: https://newsroom.spotify.com/2026-03-11/loud-and-clear-music-economics-highlights/Source snippet
On average, artists see more than half of their royalties coming from outside their home country...Read more...
-
Source: artists.popfiltr.com
Title: Pop Filtr for Artists Chartmetric
Link: https://artists.popfiltr.com/resources/chartmetricSource snippet
PopFiltr for ArtistsChartmetric - Empowering Artists with Data26 Jun 2024 — Chartmetric empowers artists with the data-driven insights th...
-
Source: reports.chartmetric.com
Title: trigger cities
Link: https://reports.chartmetric.com/trigger-cities/2024Source snippet
Chartmetric ReportsChartmetric Trigger Cities 2024Explore Chartmetric's trigger cities and learn how emerging artists and A&R executives...
-
Source: hmc.chartmetric.com
Title: how to route a tour using streaming data part 1 tour planning series
Link: https://hmc.chartmetric.com/how-to-route-a-tour-using-streaming-data-part-1-tour-planning-series/Source snippet
How Music ChartsHow to Route a Tour Using Streaming Data: Part 1March 19, 2020 — 19 Mar 2020 — Streaming and social data will only help y...
Published: March 19, 2020
-
Source: researchgate.net
Title: Research Gate(PDF) Data Matters
Link: [https://www.researchgate.net/publication/317617947Data_Matters-%27Spotify_For_Artists%27-Rae_A_2017](https://www.researchgate.net/publication/317617947_Data_Matters-%27Spotify_For_Artists%27-_Rae_A_2017)Source snippet
(2017)May 2, 2017 — 5 May 2017 — PDF | On May 2, 2017, Andrew Rae published Data Matters - 'Spotify For Artists' - Rae, A. (2017) | Find...
Published: May 2, 2017
-
Source: pitchfork.com
Link: https://pitchfork.com/news/spotify-launches-loud-and-clear-transparency-initiativeSource snippet
The initiative follows protests from the Union of Musicians and Allied Workers demanding better payment. Spotify provided data showing th...
-
Source: waterandmusic.com
Title: how the touring industry will use data in 2021 even in a pandemic
Link: https://www.waterandmusic.com/how-the-touring-industry-will-use-data-in-2021-even-in-a-pandemic/Source snippet
Water and MusicHow the touring industry will use data in 20219 Dec 2020 — Soundcharts is one of many tools that promoters and agents can...
-
Source: loudandclear.byspotify.com
Link: https://loudandclear.byspotify.com/Source snippet
Loud and ClearSpotify Loud & ClearThis site shares data behind Spotify's royalty payments and explains how money flows through the global...
-
Source: theguardian.com
Title: The Guardian Spotify is trumpeting big paydays for artists
Link: https://www.theguardian.com/music/2025/mar/12/spotify-is-trumpeting-big-paydays-for-artists-but-only-a-tiny-fraction-of-them-are-actually-thriving-loud-and-clear-reportSource snippet
The 2024 report claims that Spotify paid out $10bn in royalties last year, but the report's timing is contentious due to recent revelatio...
Additional References
-
Source: linkedin.com
Link: https://www.linkedin.com/posts/charliehellman_every-year-we-update-our-annual-loud-clear-activity-7437516808586387456-hKrMSource snippet
LinkedInSpotify Loud & Clear Report: Artist Royalties and Earningsmore than 13,800 artists generated over $100K artists at all levels now...
-
Source: musicradar.com
Title: Music Radar”Spotify is the highest-paying retailer globally
Link: https://www.musicradar.com/music-industry/streaming-sharing/spotify-is-the-highest-paying-retailer-globally-paying-the-music-industry-more-than-usd11-billion-in-2025-spotify-reveals-how-much-it-actually-pays-out-to-musicians-in-its-new-loud-and-clear-reportSource snippet
The report reveals that in 2025, Spotify paid the music industry over $11 billion, bringing its total lifetime payouts to nearly $70 bill...
-
Source: midiaresearch.com
Title: spotifys loud and clear is about fandom not royalties
Link: https://www.midiaresearch.com/blog/spotifys-loud-and-clear-is-about-fandom-not-royaltiesSource snippet
MIDiA ResearchSpotify's Loud and Clear is about fandom, not royalties24 Mar 2022 — Spotify has updated its Loud & Clear website exploring...
-
Source: youtube.com
Title: How Labels Use Streaming Data to Find New Talent
Link: https://www.youtube.com/watch?v=J32R2m195pUSource snippet
Turning Music Trends Into Business Decisions...
-
Source: youtube.com
Title: Making Sense of Spotify for Artists Data
Link: https://www.youtube.com/watch?v=QpT6a02iT1wSource snippet
How Labels Use Streaming Data to Find New Talent...
-
Source: youtube.com
Title: Using Data to Build Your Music Career
Link: https://www.youtube.com/watch?v=kY05G8eD-mISource snippet
Making Sense of Spotify for Artists Data...
-
Source: youtube.com
Title: How Music Analytics Tools Are Changing the Industry
Link: https://www.youtube.com/watch?v=Fj-yO2G_d0sSource snippet
Using Data to Build Your Music Career...
-
Source: youtube.com
Title: Turning Music Trends Into Business Decisions
Link: https://www.youtube.com/watch?v=H74t4PqT59o
Topic Tree